WSPR with 10 milliwatt
QRSS needs low power
I regularly visit the WSPR Old Database, to look for stations that use very low power. It is striking, every time, that almost all stations use much power. Because WSPR is QRSS, the power of the WSPR station can be as low as 10 mW. With a power of 10 mW your signal will only be spotted, when the propagation is good.
Many stations use 5 watts or 200 milliwatts, which is way to much, because of clutter spots that will be fill the band, when the propagation is poor.
Many operators believe, probably due to unfamiliarity with QRSS, that 5 watts is always QRP. But of course, that is not the case.
10 milliwatt is QRP with QRSS such as WSPR
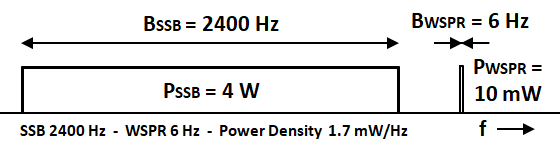
WSPR is a QRSS system, which uses a 400 times narrower bandwidth than SSB, due to the low bit rate. Therefore, the power must be reduced by the same factor to transmit a signal with a comparable strength. A WSPR signal with a power of 10 milliwatts has the same power density as an SSB signal of 4 watts. So 10 mW is a good power for a WSPR propagation beacon.
Very good propagation
From my experience with low and very low power (in the BQC marathon), I speak of very good propagation, when CW QSO’s with 200 mW or less are possible. A CW Station with 50 W then be received with S9. CW with 200 mW can be compared with a WSPR signal of 10 mW. A WSPR station with a power of 10 mW is thus only spotted if the propagation is very good.
To derive the propagation from WSPR spots, which are made with different power, I calculate the Lowest Possible Power (LPP) of the spots.
A WSPR spot with an SNR of -29 dB is received without errors. If a station with a power of 10 mW is spotted with an SNR of -19 dB, that signal is 10 dB stronger than is necessary for a “solid copy” with an SNR of -29 dB. The power could thus be 10 dB lower. The (calculated) lowest possible power is then 1 mW. Does WSPR with 10 milliwatts seem too low? Then just keep reading, to see what the LPP diagram (Lowest Possible Power diagram) shows.
Lowest Possible Power diagram
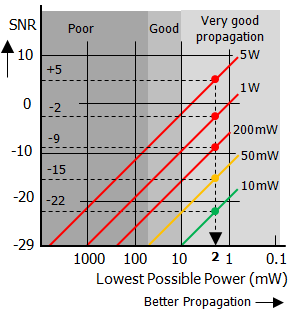
In order to determine the calculated Lowest Possible Power, but without having to calculate for myself, I developed the Lowest Possible Power diagram (LPP diagram). The diagram allows you to determine the lowest possible power from the SNR of the spot via the diagonal line of the used power.
The lower the Lowest Possible Power, the better the propagation.
From the value of the SNR you go to the right until the diagonal line, indicating the power. The spot is plotted on a diagonal line, corresponding to the power used, to the height of the SNR. And then you read the lowest possible power on the horizontal axis. The values on the horizontal axis are indicated in milliwatts.
Lowest Possible Power diagram
The green dot shows a spot of a station with 10 mW, that is received with an SNR of -22 dB. The signal is 7 dB (5x) stronger than necessary to be spotted. The lowest possible power for this spot is 10/5 = 2 mW. A WSPR signal of 2 mW can be compared with a CW signal of 40 mW, which is received with 559. Hi.
The yellow dot shows a spot of a station with 50 mW, which is received with an SNR of -15 dB. The propagation of both stations is the same because the lowest possible power is the same.
Attentive readers have already noticed, that for all the spots the propagation is the same. The LPP diagram mercilessly shows the difference between the subtle signal of a WSPR station with 10 mW and the (unnecessarily) 27 dB stronger station with 5 watts.
WSPR with 10 milliwatts
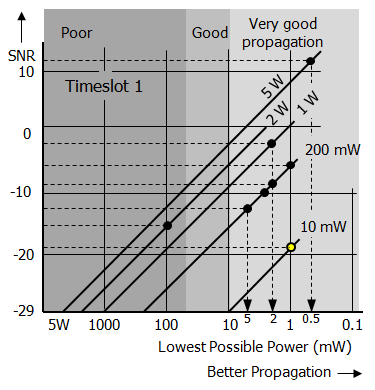
To show that even 200 milliwatts is too much for very good propagation, I show two LPP diagrams of two different time slots. A station with 10 mW from 9A, indicated with a yellow dot, is active in both time slots. The signals in both diagrams show spots received by a station in DL at 1100 km from the station with 10 mW. I have chosen these two time slots, because the diagrams show that with very good propagation, with 10 mW it is possible to work well, while there are also much stronger stations in the 200 Hz wide WSPR band. The band is 7 MHz.
Lowest Possible Power diagram
In the first time slot a large number of stations is active (8). The spot with a power of 5 W and an SNR of +11 dB has the strongest signal. This spot also exhibits the best propagation, with the Lowest Possible Power of 0.5 milliwatts. The spot with 200 mW and an SNR of -6 dB and the spot of 10 mW, both have a Lowest Possible Power of 1 mW. The propagation is the same for these two spots. The 7 spots on the right of the 10 mW line reveal that the propagation is very good. After all, they are in the light gray area with the designation: Very good propagation. The LPP diagram also shows, at a glance, that for the 6 spots, from 200 mW to 5 W, a power of 10 mW had been sufficient. Nice diagram!
Lowest Possible Power diagram
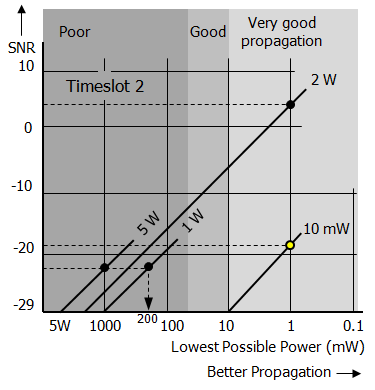
Only four signals are received in the second time slot. The spot with 2 W and an SNR of +4 dB and the spot of 10 mW and an SNR of -19 dB, both have the lowest possible power of 1 mW. Both spots have the same propagation. If the station with 2 W reduces the power to 10 mW, the signal is received with an SNR of -19 dB.
Clutter spots
I consider spots with 5 W as “Clutter spots”. A WSPR signal with 5 W can be compared to 2 kW with SSB. There are already spots, if the propagation is “next to nothing”. And when finally the propagation becomes interesting, the stations that use 10 mW can be over shouted.
If a WSPR station is spotted with 5 W with a SNR of -29 dB, then this station must use at least 2 kW to make a QSO. Spots with 5 W only show very good propagation, with an SNR of 0 dB or more. But they will leave little room in the dynamic range of the receiver for spots with 10 mW.