Power summary of confirmed QRP QSO’s
As a milliwatt enthusiast I often make QSO’s with the lowest possible power. This power summary clearly shows, what is possible with very low power. It is great fun to make contest QSO’s with 50 mW or less when the propagation is very good.
All QSO’s on this page are confirmed in with a paper QSL or via eQSL.
This means that all the QSO’s listed here are correct and also create a list of confirmed DXCC-countries.
Power categories
The power that was used in each QSO, is reduced to 12 power categories.
For example: 27 mW, 36 mW, 41 mW, 45 mW and 50 mW fall into the 50 mW category.
And 72 mW, 80 mW, 82 mW, 95 mW and 98 mW into the 98 mW category.
Power summary per DXCC-country per power category
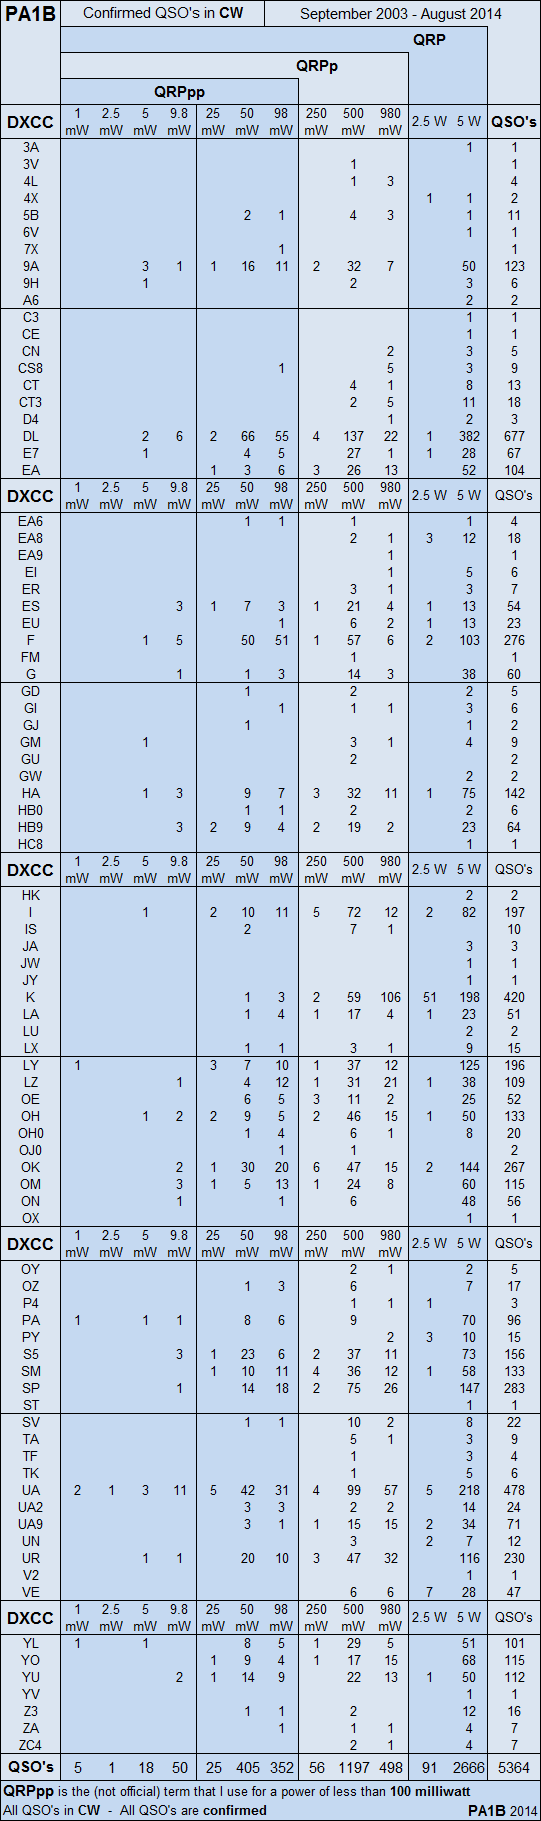
Confirmed QSO’s Per Power Category per DXCC country
Power summary per band per power category
This table indicates the number QSO’s per band per power category. In this table you can see the distribution of the power used, for each QSO per band. The data in the table “QSO’s over the years” shows that the conditions slowly change.
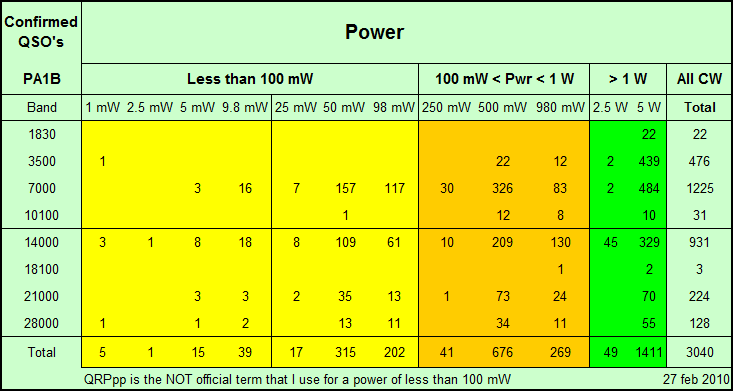
Confirmed QSO’s per Power Category per band
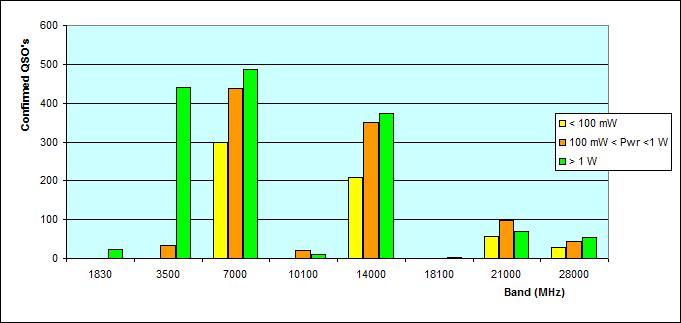
Power summary per band
In this bar chart the number of QSO’s per band with different power levels are shown. The yellow bar presents the number of QSO’s made with less than 100 milliwatts. (QRPpp) The brown bar presents the QSO’s made with less 1 watt, but more than 100 mW. (QRPp without QRPpp) The green bar presents the QSO’s made with 1 watt or more, but less than 5 watts. (QRP without QRPpp and QRPp)
I use an Inverted Vee antenna of 2 x 10.7 meters with a tuner on all bands. (1.8 MHZ – 28 MHz) This antenna is good for 7 MHz and higher, but is short for 3.5 MHz or lower. On 3.5 MHzI must use 5 W most of the time . (green bar) On 1.8 MHz sometimes it is difficult to make a QSO even with 5 W.
The yellow bar shows the number of QSO’s made with less than 100 mW. Over the years I made most of the QRPpp QSO’s on 7 MHz. This resulted in 300 Confirmed QSO’s on 7 MHz. On 14 MHz I made 208 QRPpp QSO’s. And furter 56 QSO’s on 21 MHz and 28 QSO’s on 28 MHz.
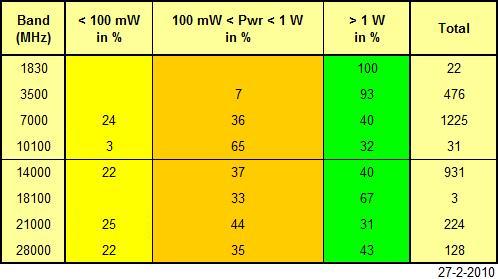
Power summary per band per power category in percent
This table shows the percentage of QSO’s made for each power level for the different frequency bands. So you see that on 7 MHz, 24% of all QSO’s were made with less than 100 mW. (QRPpp) I was surprised about the small differences in percentages of QRPpp (<100 mW) contest QSO's (7, 14, 21 and 28 MHz) which are all between 22 and 25%. Please notice that Total refers to the number of QSO's and not to a percentage. [/av_textblock] [/av_one_half] [av_one_half min_height='' vertical_alignment='' space='' custom_margin='' margin='0px' link='' linktarget='' link_hover='' padding='0px' border='' border_color='' radius='0px' background='bg_color' background_color='' background_gradient_color1='' background_gradient_color2='' background_gradient_direction='vertical' src='' background_position='top left' background_repeat='no-repeat' animation='' mobile_breaking='' mobile_display='' av_uid='av-9bx85b'] [av_textblock size='' font_color='' color='' av-medium-font-size='' av-small-font-size='' av-mini-font-size='' av_uid='av-jic2zukt' admin_preview_bg=''][/av_textblock] [/av_one_half] [av_one_half first min_height='' vertical_alignment='' space='' custom_margin='' margin='0px' link='' linktarget='' link_hover='' padding='0px' border='' border_color='' radius='0px' background='bg_color' background_color='' background_gradient_color1='' background_gradient_color2='' background_gradient_direction='vertical' src='' background_position='top left' background_repeat='no-repeat' animation='' mobile_breaking='' mobile_display='' av_uid='av-9bx85b'] [av_textblock size='' font_color='' color='' av-medium-font-size='' av-small-font-size='' av-mini-font-size='' av_uid='av-jic2zukt' admin_preview_bg='']
Power summary of confirmed QSO’s per year per power category
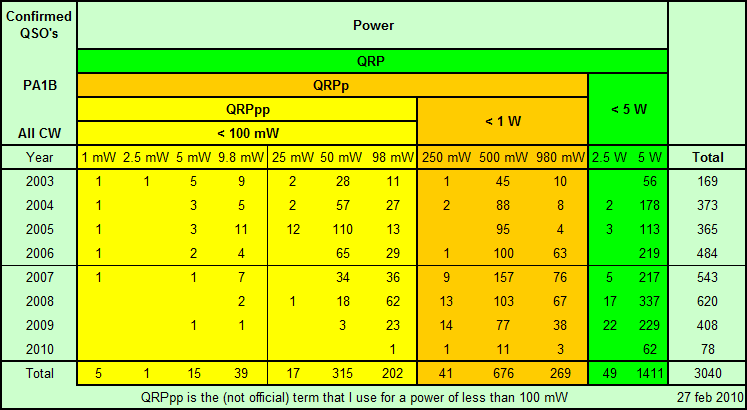
Power summary per power category per year
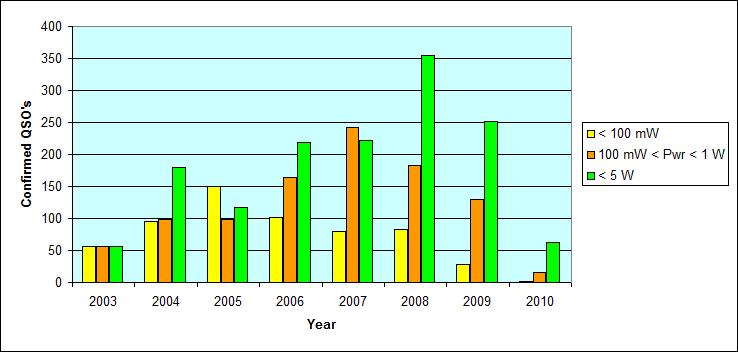
Power summary per year
In this bar chart the number of QSO’s over the years with different power levels are shown.
The yellow bar presents the number of QSO’s made with less than 100 milliwatts. (QRPpp) The brown bar presents the QSO’s made with less 1 watt, but more than 100 mW. (QRPp without QRPpp) The green bar presents the QSO’s made with 1 watt or more, but less than 5 watts. (QRP without QRPpp and QRPp)
The yellow bar is the most interesting. This bar shows the number of QSO’s made with less than 100 mW and peaks to 150 QSO’s in 2005. The decline after 2005 is caused mainly by the decreasing number of sunspots. Over the years the propagation slowly declined.
Because I often use the lowest possible power in each QSO, the number of QSO’s per year made with QRPpp, slowly decreased and the number of QSO’s with QRPp (brown bar) and QRP (green bar) increased. The number of QSO’s with more than 100 mW and more than 1 W is also increasing by increasing activity.
The decrease in the number of QSO’s in 2009, is caused by the fact that QSLs from 2008 via the bureau, are sent earlier than the QSL’s of 2009. Also in 2009 I made 7% less QSOs.
All QSO’s of 2010 shown here, are confirmed via eQSL. The QSL cards via the bureau take much more time to arrive.